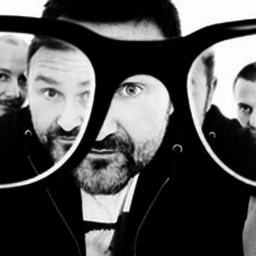
Detailed concert and song statistics on Therapy? based on 3 concerts.
Setlists3
Songs performed16
Unique songs performed16
Tags performed0
Covers performed as songs1
Covers performed as tags0
First concertFinsbury Park, London, England - Jun 6, 1992
Last concertTorhout Festival, Torhout, Belgium - Jul 1, 1995
Show Length
Each column represents the number of songs performed in a concert.Number of Encores
Each column represents the number of encores in a concert. Note that concerts without any encores are left out of this graph.Statistics by Month
Month |
Total concerts |
Songs performed |
Tags performed |
Unique songs performed |
Encore songs performed |
|---|---|---|---|---|---|
| 1992 / June | 1 | 0 | 0 | 0 | 0 |
| 1994 / August | 1 | 16 | 0 | 16 | 1 |
| 1995 / July | 1 | 0 | 0 | 0 | 0 |
| Totals | 3 | 16 | 0 | 16 | 1 |
Top Songs
Name |
Total |
|---|---|
| Potato Junkie | 1 6.25% |
| Knives | 1 6.25% |
| Screamager | 1 6.25% |
| Unbeliever | 1 6.25% |
| Trigger Inside | 1 6.25% |
| Me vs You | 1 6.25% |
| Hellbelly | 1 6.25% |
| Meat Abstract | 1 6.25% |
| Neck Freak | 1 6.25% |
| Teethgrinder | 1 6.25% |
| Disgracelands | 1 6.25% |
| Die Laughing | 1 6.25% |
| Unrequited | 1 6.25% |
| Nowhere | 1 6.25% |
| Lunacy Booth | 1 6.25% |
Top Covers
Name |
Total |
|---|---|
| Isolation by Joy Division | 1 100.00% |
